Repeatability vs. Linearity vs. Resolution: How to Read a Sensor Specification Sheet
Sensor catalogs list items such as “repeatability,” “linearity,” and “resolution.” They all look like they are about the same “accuracy,” but the three values answer different questions. This article introduces those differences and how to read the conditions attached to the values.
There are “visible errors” and “invisible errors”
The difference between a measured value and the true value is called error. Errors are easier to understand when divided into two kinds with different characteristics.
- Shift error: Error that shifts the value in the same direction by the same amount every time under the same conditions. For example, a sensor mounted at an angle gives a value shifted by the same amount no matter how many times it measures the same workpiece.
- Repeatability error: Error whose size and direction change each time you measure. It is caused by things such as noise inside the sensor and appears as variation in values.
Repeatability error becomes visible as soon as you measure a few times. Shift error, on the other hand, gives the same value no matter how many times you measure, so you cannot notice it just by looking at the values. A stable value is not proof that the value is correct. Shift error can be found only by comparing with a reference whose value is known.
Note that the word “accuracy” is used both for the two combined and for only one of them. When you read a specification sheet, look at which kind of error the value shows rather than at the name of the item.
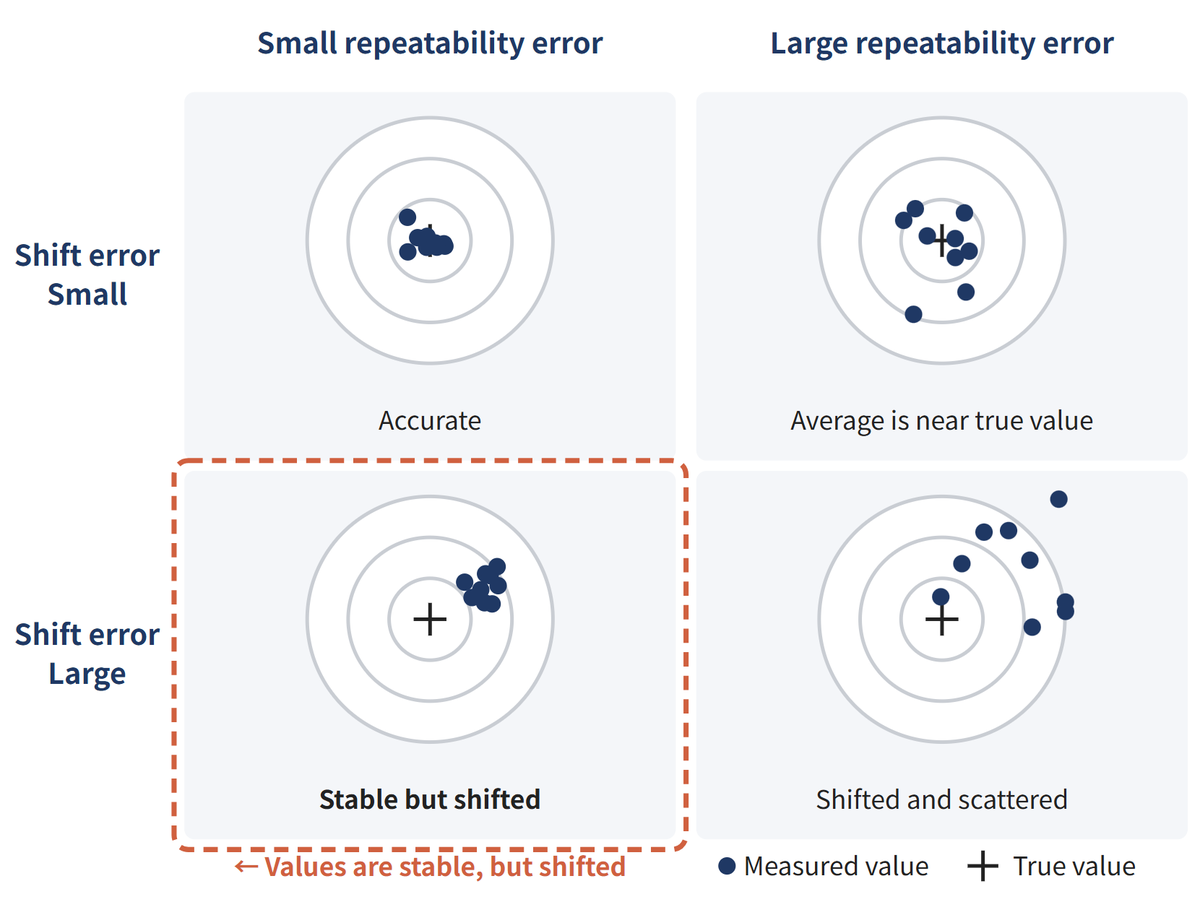
Repeatability: do you get the same value no matter how many times you measure?
Repeatability is the width of the variation in values when the same point on a stationary workpiece is measured many times. In other words, it shows the size of the repeatability error.
The key point is that the value is measured without setting the workpiece again. At the μm level (1/1000 of 1 mm), each time a workpiece is set again, the measured spot and the workpiece’s position and angle change slightly. So on a shop floor where workpieces are measured one after another, the variation is larger than the value on the specification sheet.
Resolution: how fine a change can the sensor distinguish?
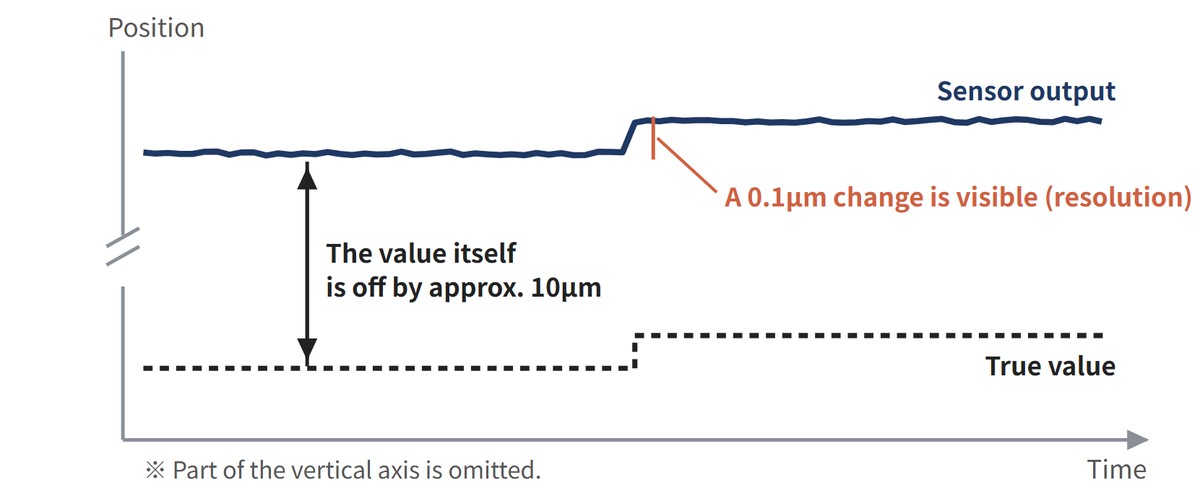
Resolution is the size of the smallest change a sensor can distinguish. The smaller the value, the finer the changes the sensor can catch. Note that the variation in values when a sensor keeps measuring the same stationary point is called “repeatability” by some manufacturers and “resolution” by others.
The important point is that resolution is about “fineness,” not “correctness.” The handbook uses a fictitious laser displacement sensor (measuring range ±5 mm, repeatability 0.1 μm, linearity ±0.1% of F.S.) as an example. This sensor can catch changes of about 0.1 μm. Even so, calculated from its linearity, the value itself can be off by up to 10 μm.
Resolution pays off when you measure changes or differences, such as measuring a step by measuring two nearby points one after the other and taking the difference. On the other hand, in an inspection that judges whether the value itself is within tolerance (the acceptance range), seeing fine changes is not enough.
Linearity: is the value correct anywhere in the measuring range?
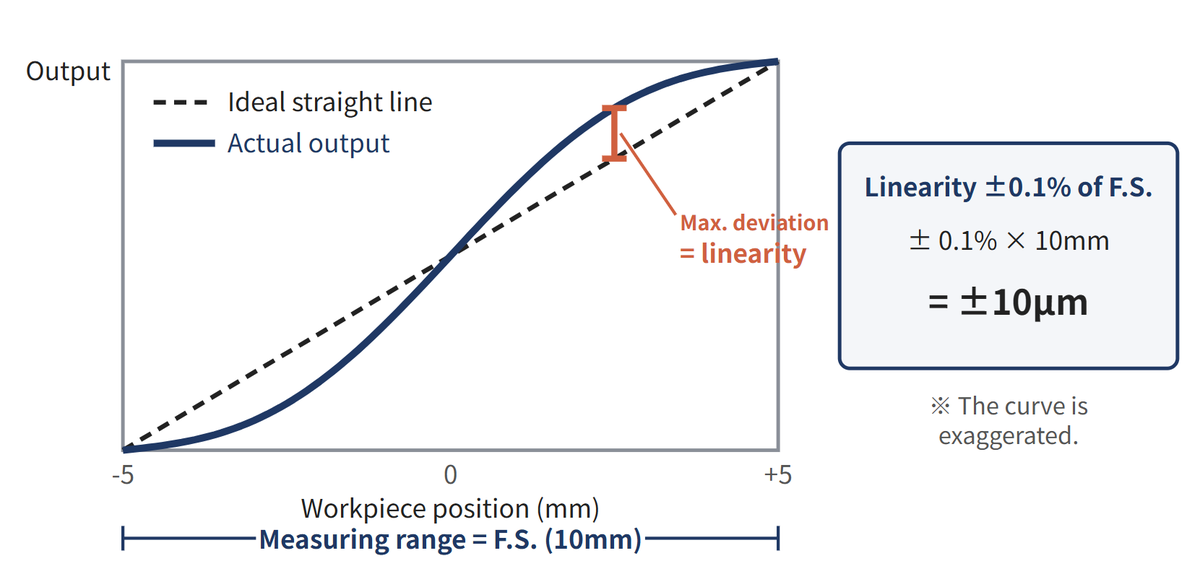
Ideally, the output of a displacement sensor is directly proportional to the position of the workpiece and forms a single straight line on a graph. The actual output curves slightly away from this line. The maximum of that deviation is the linearity.
Linearity is generally given as a percentage of the full measuring range (F.S., full scale). In the earlier example, the measuring range is ±5 mm, so F.S. is 10 mm. ±0.1% of F.S. corresponds to ±10 μm. This means that “somewhere in the range, the value can be off by up to ±10 μm.” It does not mean that the value is always off by 10 μm everywhere.
Linearity deviation appears by almost the same amount every time at the same position. In other words, it is a kind of shift error. It does not get smaller when you increase the number of averages, and you can find it only by comparing with a reference such as a master workpiece of known dimensions.
For the same “% of F.S.,” the wider a sensor’s measuring range, the larger the error in μm. The basic rule is to select a sensor that matches the range you will actually use.
Specification sheet values apply under the conditions stated in the notes
Side by side, the three values compare as follows.
| Item | Question it answers | What it shows | Where it helps |
|---|---|---|---|
| Resolution | How finely can the sensor distinguish differences? | Fineness (mostly determined by the variation in values) | Measuring changes and differences |
| Repeatability | Do you get the same value no matter how many times you measure? | Repeatability error (variation) | Making judgments stable |
| Linearity | Is the value correct anywhere in the range? | Shift error (offset) | Judging the value itself |
Moreover, every value is measured under the best conditions. The conditions are written in the notes or footnotes below the table. In the handbook’s example, the repeatability comes with the following conditions.
- Standard target: A white object with an even surface that diffuses light well is measured. When there is little reflected light, as with a black workpiece, the variation becomes larger.
- Reference distance: The measurement is made at the center of the measuring range. The variation changes with the position within the range.
- Number of averages: The value is the average of 4096 measurements. If the variation occurs independently each time, averaging N measurements reduces it to about 1/√N. With 4096 averages, that is about 1/64.
Before using a value from a specification sheet, check the following in this order.
- Find the conditions attached to the value in the notes, footnotes, and instruction manual
- Compare the workpiece color and size, distance, temperature, and speed with those conditions
- If they differ, select with a margin or test with actual workpieces
Specification sheet values are a starting point for selecting a sensor. The numbers become meaningful only when you set them side by side with the conditions on your own shop floor.
Summary
- Repeatability shows “whether you get the same value no matter how many times you measure” (variation), linearity shows “whether the value is correct anywhere in the range” (offset), and resolution shows “how fine a difference the sensor can distinguish.”
- Fine resolution does not mean the value is correct. A stable value may still be off.
- Specification sheet values are measured under the best conditions stated in the notes. Compare those conditions with how you will use the sensor before relying on them.
Learn more: Official Handbook “FA Sensors: The Complete Guide — Basic”, Lesson 9 (see also Lesson 6 and Lesson 11)
This topic is within the scope of the Basic Level exam of the Practical Sensor Certification.